Hilbert Curve in Python
After playing with creating a Hilbert Curve in CFDG, I started thinking about how to implement it in Python. I wanted a way to do so which was easy to understand and which only needed a small amount of data to describe the process.
I decided to write one rule for one specific generation of the curve, and then rotate that rule 4 times, and then for each of those rules flip them. I decided to use a two-character string to decide the basic shapes. The shape can be one of u, [, n, ] where they represent the orientation of the basic u-shaped curve:


I decided to write one rule for one specific generation of the curve, and then rotate that rule 4 times, and then for each of those rules flip them. I decided to use a two-character string to decide the basic shapes. The shape can be one of u, [, n, ] where they represent the orientation of the basic u-shaped curve:
As well as that, I had to include the direction around the shape I was going, either 'a' for anti-clockwise, or 'c' for clockwise. So to draw the shape above starting at the top left, I would call it 'ua': It's in the 'u' orientation, drawing anti-clockwise.
I then had to make a mapping, that for a certain shape, eg 'ua', tells us how to treat that shape when we split it into 4 smaller quadrants. I made the starting shape the key, and the values tuples of (quadrant, newshape) with the quadrants numbered as shown below:
So the mapping for 'ua' to the next generation is:
{'ua': [(0, ']c'), (2, 'ua'), (3, 'ua'), (1, '[c')]}
Now all that's left is to rotate three times, to give the [, n, ], anticlockwise rules, then mirror each of those until we finally have all 8 rules. Once this is done, I wrote a function that takes a square power-of-2 2d array, splits it into quadrants and applys the next rule to each quadrant. I made the function then yield the value of the array at that point, that way it essentially maps a 2d array of values into a list of values taken in order following a hilbert curve. To check it worked I made it us Tkinter to plot the values it was returning. The full code is here (also available on github):
# mfm 18Mar13 Trying to make a generator that returns values
# from a 2d array in a hilbert curve
import numpy


def make_mapping(m):
    """
    Return a dictionary built up of a single mapping m rotated and flipped.
    The keys are 2 character strings where
    the first is one of [,],u,n and the second is either 'a'nticlockwise or
    'c'lockwise. The values are a list of integer, tuple pair which
    specify how to split up the 4 quadrants and which (shape, direction)
    pair to apply to it.
    The quadrants are
    ---------
    | 0 | 1 |
    ---------
    | 2 | 3 |
    ---------
    """
    quads = [0, 1, 3, 2]  # quadrants in clockwise order
    shapes = ['u', '[', 'n', ']']  # shapes rotated clockwise
    rots = ['a', 'c']  # possible rotations

    def next(item, list, pos=1):
        """
        Given a list and an item, reurns the item in the list
        pos places after the item.
        Wraps around the list at the boundaries
        """
        return list[(list.index(item) + pos) % len(list)]

    other_direction = lambda x: next(x, rots)
    next_quadrant = lambda x: next(x, quads)
    next_shape = lambda x: next(x, shapes)

    def rotate(key):
        rotated_value = [(next_quadrant(quad), next_shape(shape) + dirn)
                         for quad, (shape, dirn) in m[key]]
        shape, dirn = key
        return next_shape(shape) + dirn, rotated_value

    def flip(key):
        flipped_value = list(m[key])
        flipped_value.reverse()
        flipped_value = [(quad, shape+other_direction(dirn))
                         for quad, (shape, dirn) in flipped_value]
        shape, dirn = key
        return shape + other_direction(dirn), flipped_value

    key = m.keys()[0]
    while True:
        key, value = rotate(key)
        if key in m:
            break
        m[key] = value

    for key in m.keys():
        newkey, value = flip(key)
        m[newkey] = value

    return m

hilbert_mapping = make_mapping(
    {'ua': [(0, ']c'), (2, 'ua'), (3, 'ua'), (1, '[c')]})


def apply_mapping(ar, mapping, pos):
    """
    split the 2d array ar into 4 quadrants and call
    apply_mapping recursively for each member of map[pos]
    If ar is 1x1, yield ar
    """
    try:
        y, x = ar.shape[:2]
    except ValueError:
        print ar, ar.shape
    if y <= 1 and x <= 1:
        yield ar[0, 0, ...]
    else:
        # quad indices here are:
        #  0  1
        #  2  3
        # (nb unlike hilbert_v1!)
        first_half = slice(None, x / 2)
        secnd_half = slice(x / 2, None)
        quads = [ar[first_half, first_half, ...],
                 ar[first_half, secnd_half, ...],
                 ar[secnd_half, first_half, ...],
                 ar[secnd_half, secnd_half, ...]]
        for quadrant, newpos in mapping[pos]:
            for x in apply_mapping(quads[quadrant], mapping, newpos):
                yield x


def hilbert(ar):
    for x in apply_mapping(ar, hilbert_mapping, 'ua'):
        yield x


if __name__ == '__main__':
    def showpoints(a, side):
        import Tkinter as tk
        from threading import Thread
        scale = 4
        border = 10
        # we draw points in the order given. We assume the value of the array
        # is it's C style position in a contiguous 2d square array
        w = scale * side + 2 * border
        canvas = tk.Canvas(width=w, height=w)
        canvas.pack(expand=tk.YES, fill=tk.BOTH)
        canvas.create_window(w, w)

        def draw():
            startpos = None
            for p in a:
                nextpos = (border + scale * (p % side),
                           border + scale * (p // side))
                if startpos is None:
                    startpos = nextpos
                else:
                    canvas.create_line(startpos[0], startpos[1],
                                       nextpos[0], nextpos[1])
                startpos = nextpos
        Thread(target=draw).start()
        tk.mainloop()

    s = 128
    x = numpy.arange(s * s).reshape(s, s)

    #xl = list(hilbert(x))
    # print xl
    showpoints(hilbert(x), s)
When run, it produces this output:

PNGs and Gifs
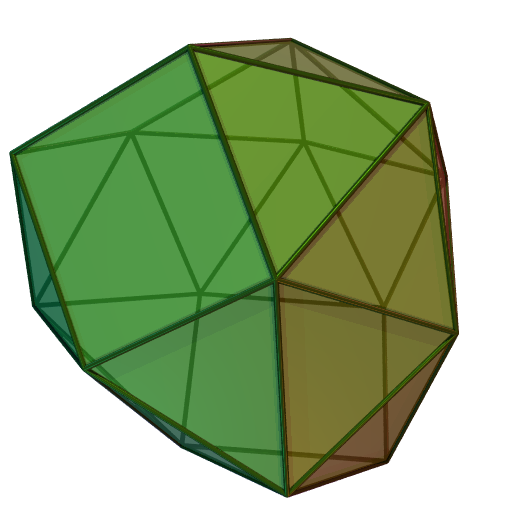
The Hilbert curve is meant to give you positions that, generally, are pretty close to one another. So if we take an image, say a disphenocingulum (which just happened to be 512x512 on wikimedia, and I have no idea what a disphenocingulum is ):
And we display is still as a 512x512 image, but this time the pixels follow the Hilbert curve as you go across each row, starting again at the beginning of the next row, then you get:

As you can see, it's definitely made the image, more, erm, horizontal. I was hoping that this could actually lead to improved compression for lossless formats like PNG and GIF. After experimenting with a few images, the 'Hilberted' images were always slightly bigger than the originals for PNG and slightly smaller than the originals for GIF (using PIL/Pillow for making the images).
Here's the size in kB for each method, for a collection of 512x512 PNG files found on the internet. The alpha channel, if there, was removed and set to black for each image beforehand:
Filename
|
Regular PNG
|
Hilberted PNG
|
Regular GIF
|
Hilberted GIF
|
002.png
|
64
|
89
|
78
|
62
|
android_sh.png
|
118
|
143
|
160
|
146
|
Disphenocingulum.png
|
91
|
104
|
165
|
154
|
edbang10.png
|
203
|
211
|
91
|
84
|
gear.png
|
107
|
122
|
114
|
95
|
imaso-512x512.png
|
253
|
272
|
156
|
140
|
iPhone 512x512.png
|
56
|
55
|
81
|
69
|
quiet 512x512.png
|
10
|
21
|
70
|
67
|
Todo-4-App-Icon-512.png
|
315
|
342
|
252
|
244
|
I think the reason for this is that GIF strictly encodes left-to-right and top-to-bottom, and in this case the 'Hilberted' versions do have more similarity left-to-right. However, PNGs have the ability to compare either the previous pixel to the left, or the pixel above (see here for details) or a combination of both. This simple approach to treating the data as 2d instead of 1d like GIF seems to really help with images with solid blocks of color, and although it's a lot simpler than the Hilbert method described above, it seems to produce better compression.
For GIFs, the Hilberted version is always slightly smaller (for the images tested). Note that for 5 out of the 9 images tested, the Hilberted GIF provided the smallest filesize out of all of the possibilities.
I'm including the code below. It needs the code above in a file called 'hilbert.py' to work. It has a variety of command line options for outputting processed and unprocessed images, and selecting the format to use. Hopefully they're documented well enough to make some sense.
The code for these two files can also be found on github.
# 2013-04-03 Trying Code && Beer at Substantial.
# what happens if we take the pixels in an image,
# rearrange using a hilbert curve, then save as png?
# is there any increase (or decrease) in compression
try:
    import Image  # needs PIL for this
except ImportError:
    from PIL import Image

import hilbert
import numpy as np
from StringIO import StringIO


def to_hilbert(im):
    im_dat = np.asarray(im)
    w, h = im.size

    if w & (w - 1) != 0 or h & (h - 1) != 0:
        print "Warning, dimensions", w, h, "not powers of two!"

    # let's create a new image for the transformed data
    imout = Image.new(im.mode, (w, h))
    imout_dat = imout.load()

    imout_dat_pos = 0
    for px in hilbert.hilbert(im_dat):
        imout_dat[imout_dat_pos % w, imout_dat_pos // w] = tuple(px)
        imout_dat_pos += 1
    return imout


def from_hilbert(im):
    w, h = im.size

    if w & (w - 1) != 0 or h & (h - 1) != 0:
        print "Warning, dimensions", w, h, "not powers of two!"

    # let's create a new image for the transformed data
    imout = Image.new(im.mode, (w, h))
    imout_dat = imout.load()

    imout_dat_pos = 0
    im_dat = im.load()
    # we create a matrix of x and y positions which we pass in
    xy = np.dstack(np.mgrid[0:h, 0:w])
    for (px, py) in hilbert.hilbert(xy):
        imout_dat[int(py), int(px)] = tuple(
            im_dat[imout_dat_pos % w, imout_dat_pos // w])
        imout_dat_pos += 1
    return imout


def to_image(im):
    w, h = im.size
    # let's create a new image for the transformed data
    imout = Image.new(im.mode, (w, h))
    imout_dat = imout.load()

    imout_dat_pos = 0
    for px in im.getdata():
        imout_dat[imout_dat_pos % w, imout_dat_pos // w] = tuple(px)
        imout_dat_pos += 1
    return imout


def test(file):
    im = Image.open(file)
    imout = to_image(im)
    assert(all(map(lambda (x, y): x == y, zip(im.getdata(), imout.getdata()))))
    imout = to_hilbert(im)
    imout = from_hilbert(imout)
    assert(all(map(lambda (x, y): x == y, zip(im.getdata(), imout.getdata()))))


if __name__ == '__main__':
    # we can test this on the 512x512 pngs in testpngs folder in bash with:
    # for f in testpngs/*; do python hilbert_png.py -t -f GIF -u "$f"; done;
    # this test, using GIF format, with unprocessing too
    import argparse
    parser = argparse.ArgumentParser()
    parser.add_argument("file", help='The file to load')
    parser.add_argument(
        "--test", "-t", action='store_true',
        help="Doesn't write files, just calculates the sizes")
    parser.add_argument(
        "--reversehilbert", "-r", action='store_true',
        help="Reverses the effect of the program. Will restore the original image")
    parser.add_argument(
        "--unprocessed", "-u", action='store_true',
        help="Write an unprocessed file as well as a processed one.")
    parser.add_argument(
        "--outfile", "-o",
        help="File to write to.", default="out")
    parser.add_argument(
        "--unprocessedoutfile", "-uo",
        help="File to write unprocessed data to.")
    parser.add_argument(
        "--format", "-f",
        help="The format to use.", default="png")
    args = parser.parse_args()
    infile = args.file  # "out.png"
    im = Image.open(infile)
    # test("out.png")
    func = to_hilbert if not args.reversehilbert else from_hilbert
    if args.test:
        s = StringIO()
    else:
        ofile = args.outfile
        ofile += "." + args.format
        s = open(ofile, 'wb')

    imout = func(im)
    imout.save(s, format=args.format)
    if args.test:
        print "Size of hilberted %s %dKb" % (args.format, s.len / 1024)
    s.close()

    if args.unprocessed:
        if args.test:
            s = StringIO()
        else:
            ofile = args.unprocessedoutfile or 'unprocessed'+args.outfile
            ofile += "." + args.format
            s = open(ofile, 'wb')

        imout = to_image(im)
        imout.save(s, format=args.format)
        if args.test:
            print "Size of regular %s %dKb" % (args.format, s.len / 1024)
        s.close()
Very cool! Just got here from this youtube vid, https://www.youtube.com/watch?v=DuiryHHTrjU and this is a perfect compliment to it. Thanks!
ReplyDelete